
You keep pouring resources into hiring, but are you quite sure if it’s truly making the impact it should? Today, simply filling open roles isn’t enough to drive real growth or solve strategic challenges. What truly matters is understanding the efficiency and quality of your talent acquisition efforts. This isn’t just a concern for HR; it indicates the health of your entire company.
This article dives into the key metrics to capture on your recruitment dashboard – the numbers that cut through the noise and tell you what’s happening. We’ll explore how long it actually takes to get a new hire productive, if your initial outreach messages are even getting noticed, and whether your application process is driving away top talent. We’ll also look at how diverse teams make better decisions and how to measure the quality of your hires. By tracking these crucial indicators, you’ll gain the insights needed to refine your approach and build the kind of teams that truly propel your organization forward.
1. Time to Hire

This metric measures how long (number of days) it takes from the moment a candidate enters your pipeline, say, when they applied or are sourced, to the day they accept your offer. It sounds simple, but it tells a lot. Long hiring time usually means something’s broken: it may be that your interview process drags, maybe decisions take too long, or maybe you aren’t aligned on what a good candidate looks like. And those delays cost you. A longer time to hire means your competitors get an edge over you by snatching the better candidates.
It’s crucial to understand that Time to Hire isn’t just a speed test. It tells a story about your candidate’s experience, internal alignment, recruitment team, tech efficiency, and even how competitive your offer is. If you are hiring for critical roles like tech, finance, or leadership, then slow hiring can mean missing your quarterly goals or stalling key projects.
So no, this isn’t just an HR metric. It’s a company health signal. If your time to hire is bloated, fix it. Map the stages, track where people drop off, and shorten what doesn’t matter. Speed doesn’t kill quality or efficiency – it unlocks it. In hiring, it’s often the difference between winning and losing quality talent.
2. Candidate Callback Rate

The Candidate Callback Rate is a metric that tells you if your initial reach-outs in hiring are actually working. Simply put, it’s the percentage of candidates who bother to reply to a recruiter’s message: whether that’s a call, an email, a LinkedIn InMail, or anything else.
How to calculate it?
(Number of Candidate return calls or responses ÷ Total Outreach Attempts) × 100
For example, imagine your team calls 100 people and only 20 reply. That’s a 20% callback rate. It’s a pretty strong hint that you need to rethink things. Are you even reaching out to the right people? Is your Employee Value Proposition (EVP) clear and attractive? Are you using the right channels at the right time?
This rate is your signal for whether your recruitment pitch is hitting home. If the numbers are low, that’s a red flag. It means your outreach message is boring or just doesn’t match what candidates are looking for. In today’s competitive job market, recruiters are marketing the jobs. If you can’t grab someone’s interest in a few seconds, your whole sourcing effort might fall flat.
Improving this number usually comes down to trying new ways to reach out: sharpening your message plus making things more personal. It’s essential to frame your message effectively so that candidates perceive it as offering them genuine value. It impacts job seekers’ decisions.
3. Application Completion Rate
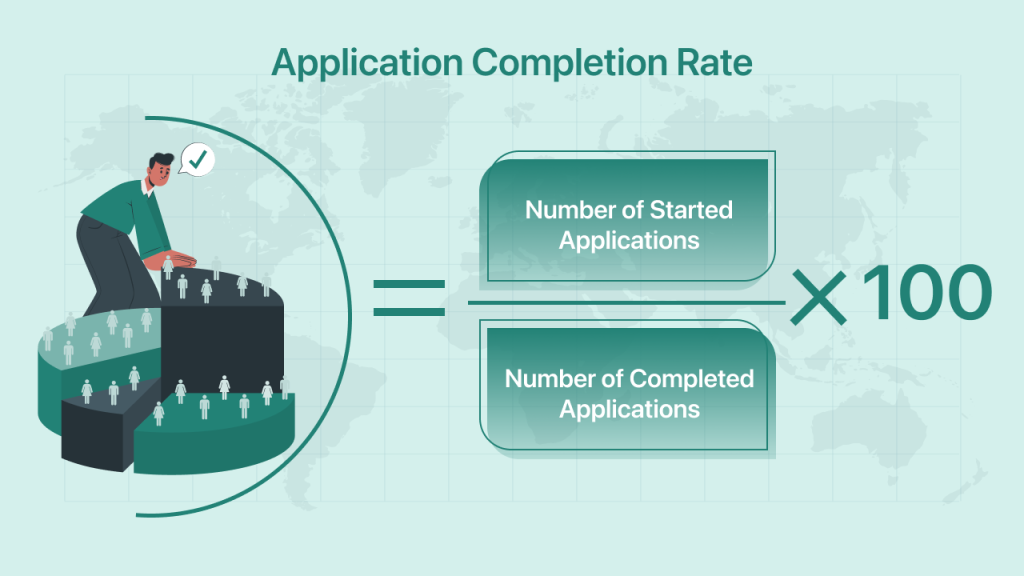
This metric tells you how many people who start applying for a job actually finish it. If most people drop off halfway, something in your application process is turning them away. Maybe the form is too long. Maybe it’s not mobile-friendly. Or maybe your platform just doesn’t work well in some browsers.
How to calculate it?
(Number of Completed Applications ÷ Number of Started Applications) × 100
The thing is, top candidates don’t have time to wrestle with clunky systems. If you make them upload a resume and ask them to re-enter every detail, they’ll likely quit.
If your application completion rate is low, it’s time to reflect on the process from a job seeker’s perspective. How many clicks does it take? Can they pause and come back later? Are there confusing or unnecessary questions?
Even small friction points add up. And every abandoned application could be a missed hire. To fix it, audit the experience, simplify what you can, and if possible, ask people why they stopped. The data and their answers will tell you what to do next.
4. Source of Hire
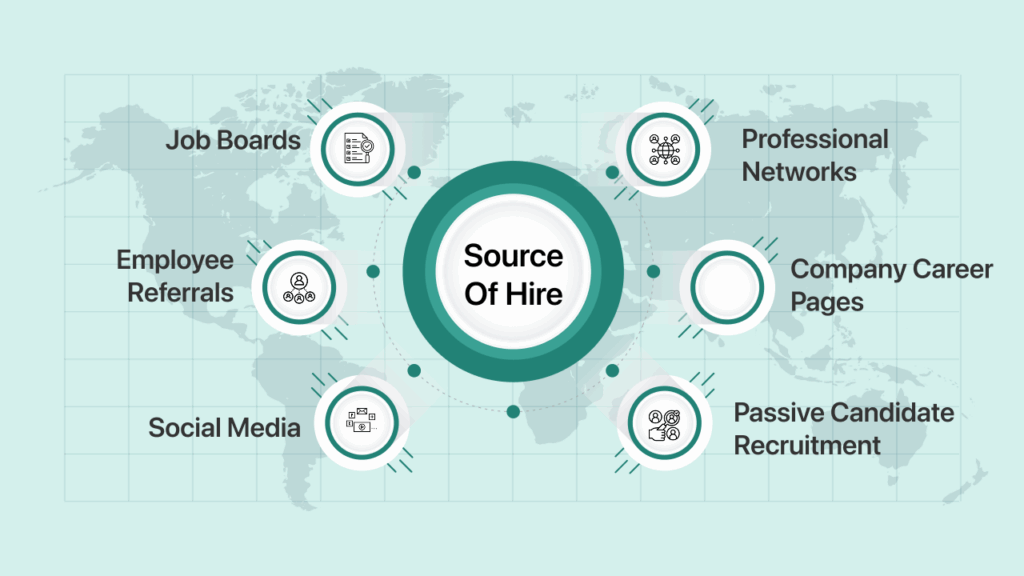
Hiring source is one of those metrics that sounds basic but does heavy lifting. It tells you exactly where your hires are coming from: job boards, social media, referrals, your career page, agencies, etc. Prima facie, this is just a simple count. But if you dig deeper, it becomes a tool for smarter budgeting and better strategy. Let’s say your data shows most of your candidates are coming through your company’s career page, not from expensive agencies. That’s a sign to invest more in your internal talent brand and rethink your agency contracts.
It not only helps you track where candidates came from, but also detects which channels are attracting the most job seekers, and which openings in your company. It all helps you in allocating resources accordingly.
5. Source Channel Effectiveness
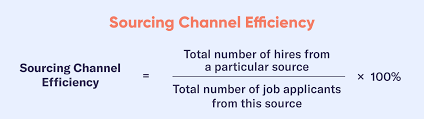
This metric helps you determine which of your recruitment channels are yielding results. Not just in terms of traffic, but in terms of solid, real candidates. It’s easy to get distracted by high visibility through job boards, sourcing tools, social platforms, paid ads, etc. All they do is drive clicks. But clicks aren’t candidates, and impressions aren’t intent. What matters is how many of those clicks translate into qualified applicants, interviews, and eventually, hires.
You can measure it by first counting the volume. Count how many people came in through each channel in a given time frame. This gives you a baseline. The next step is to quantify how many of those were actual quality candidates. People who passed the screening, made it to interviews, or got offers. That’s where you will see the difference between quantity and quality.
A practical way to track this is by using tools such as Google Analytics or your ATS’s built-in reports. Check where visitors came from – was it LinkedIn, Facebook, a job board, or your career page? Then compare the conversion rate. You might find that one channel gives you many clicks, but only a few apply. Another brings fewer people, but a better one.
6. Cost Per Hire

It is one of the clearest ways tomeasure the efficiency or expense of your hiring process. It tells you how much money you’re spending to fill an open role. It’s the straightforward way to see exactly what you’re spending to get someone new on board. That means counting everything: your recruiters’ paychecks, those job ads, background checks, referral bonuses, and even setting up new employees.
This metric is super important. Eventually, every talent manager gets asked: “How much are we spending to bring new people in?” And “Is it worth it?” Having this clear figure helps you answer. It also gives you a solid base for planning future hiring budgets, especially for high-volume hirings or notoriously hard-to-fill positions.
How to calculate it?
Cost per Hire = (Internal + External Recruiting Costs) ÷ Number of Hires.
Interested to know more about Cost of Hire – Click Here
7. First Year Turnover Rate

This metric tracks the share of new hires who leave before they hit their one-year mark. It’s a sharp indicator of how well you are hiring, onboarding, and setting expectations.
There are two types of first-year turnovers: managed and unmanaged.
Managed turnover is when the company terminates the contract. This is generally an indicator of poor performance or fit for the company. Meanwhile, in unmanaged turnover, the employee leaves voluntarily. This is often an indicator of unrealistic expectations or poor onboarding that made the candidate leave.
According to Work Institute’s Retention Report, around 37.9% of all turnovers happen within the first year, and are linked to mismatched expectations or lack of development opportunities.
This is a real cost for your company. It is generally harder and costlier to refill positions due to turnover than to fill new roles. It’s crucial to study which department or manager faces higher turnover and whether these turnovers are managed or unmanaged. The fix starts by better aligning both parties’ expectations from the start, and a structured onboarding process that supports the newbie from day one.
How to calculate it?
(Number of employees who left during the first year of the job ÷ Total number of employees who joined during that year) 100
8. Candidate Experience

Experience of the candidate is not just a metric about how friendly your interviewers were or how sleek your emails looked. It’s about how candidates felt throughout the entire process. Did they feel respected, informed, and treated like their time mattered? That perception, whether they get the job or not, can shape your brand image. It can decide how they talk about your company to others, or whether they would ever apply again.
A common way to track it is through surveys, often using something like a Net Promoter Score. Ask candidates to rate their experience, usually after interviews or post-application. You might ask about clarity of communication, interviewer professionalism, ease of applying, or how long they waited to hear back. The key is to survey everyone, not just the ones who got an offer. Rejected candidates often give the most honest (and useful) things to say
How to calculate it? Group experience ratings into positive and negative buckets, for example, 0–5 as negative, 6–10 as positive. If 80 out of 100 candidates gave positive feedback, it means your score is 80%. Simple, but powerful. A poor candidate experience won’t always show up in your hiring numbers right away—but it’ll drag down your employer brand in the long run.
9. Time to Productivity

It is a crucial metric for your business. It’s not just about how quickly you fill a spot; it’s about how much time it takes for a new hire to get fully up to speed and genuinely contribute to the team. It helps you understand if your onboarding and training programs are truly effective, or if new hires are just floundering for too long.
A study by APQC (American Productivity & Quality Center) found that, at the median, organizations take around 35 days to bring new hires up to productivity. However, this varies wildly by role complexity and industry. If your numbers are much higher, it’s a big hint that you might need torefine your hiring process, improve your onboarding, or offer better support. Getting new employees productive faster means less wasted time and resources, and a quicker return on your investment in new talent.
How to calculate it?
You first need to decide what “fully productive” actually means for that specific job. This isn’t the same for everyone. It could be hitting a certain sales target, confidently managing complex tasks alone, or consistently getting great customer feedback. You’re setting a clear finish line.
Next, you mark the new hire’s official start date – that’s your clear beginning.
Then, you track their progress. Managers regularly check in, assess performance against those “fully productive” goals you set, and note when they start hitting those targets consistently.
The moment that the new hire reliably meets those pre-defined productivity standards? That’s their “productivity date”.
Finally, you just subtract the start date from their productivity date. That number of days, weeks, or months is their individual “Time to Productivity.” To get an overall picture, average this number across all your new hires. It tells you exactly how long it takes for your new talent to truly activate gears.
10. Quality of Hire

It answers one of the hardest questions in recruiting: Did we hire the right person? It’s not just about whether the hire showed up and did the job – it’s about whether they added value. That can mean different things depending on the role or company. However, it usually includes culture fit, retention, and how quickly they get up to speed, along with standard metrics such as job performance.
Making “Quality” Objective
The real challenge is that a lot of it is subjective. One manager’s “great hire” might be another’s “just okay.” That’s where industrial-organizational psychology helps. It pushes for structured, reliable ways to evaluate performance – like behaviour-based assessments, peer feedback, or standard ramp-up benchmarks. You’re trying to move beyond gut feelings and capture consistent signals of job success.
Most teams use scoring systems – maybe rating performance, culture fit, and ramp-up time on a 1–10 or 1–100 scale, then averaging them. Others combine this with retention data or promotion timelines. You can also track your success ratio: how many new hires are rated as high performers vs. the total hired. If the ratio is low, your hiring process might need a tune-up.
What matters most is alignment. You have to define what a good hire looks like with your leadership team first. Otherwise, you’re just scoring shadows.
How to calculate it?
(Performance rating score + Ramp-up time score + Culture fit score + Engagement score
Number of factors or scores
How Quality of Hire Affects Your Hiring Budget ROI – Read More Here
11. Candidate Diversity

When we talk about candidate diversity, we’re focusing on the different backgrounds, experiences, and demographics within your group of applicants. You can track this by using tools like candidate surveys or by examining your hiring feedback. This matters because diverse teams tend to be more innovative and are87% more likely to make better decisions, so not prioritizing it can put you at a competitive disadvantage. This makes diversity a critical recruitment goal for any organization serious about hitting its targets. Ignoring it can also lead to an adverse impact, where employment practices unfairly disadvantage protected groups.
For instance, the “four-fifths rule” helps flag this. For example, if women are being selected at less than 80% the rate of men for a given stage, that’s a warning sign. Ultimately, prioritizing a diverse candidate pool isn’t just about ticking boxes; it’s a strategic move to build stronger, smarter teams and ensure fair hiring practices.
In closing, optimizing talent acquisition is no longer just about instincts; it’s about leveraging precise data. The metrics we’ve explored – from how long it takes to hire and first-year departures, to candidate experience and quality of hire – these are the real bedrock of smart recruiting.
For CHROs looking to move past guesswork and truly drive measurable impact, these insights are invaluable. Imagine having all this intelligence right at your fingertips, not just as raw numbers, but as actionable knowledge that truly transforms your entire hiring ecosystem.
This is exactly where valuematrix.ai steps in, empowering you to spot inefficiencies, amplify your strengths, and build culturally cohesive, exceptional teams with AI-powered strategies and intelligent hiring techniques backed by established psychological frameworks.
About Us
ValueMatrix helps organizations build culturally cohesive teams with AI-powered recruitment and retention strategies. We educate corporate leaders on the importance of involving and encouraging all generations to adopt enterprise values and participate actively to achieve excellence.
Our AI-powered platform transforms talent acquisition with intelligent hiring techniques backed by established psychological frameworks. We partner with HR professionals to conduct unbiased and holistic assessments for aspiring candidates.